Streaming real-time data in the Internet of Things (IoT) involves collecting, processing, transmitting, and analyzing data generated by IoT devices in real time. This allows applications to respond promptly to changes or events, enabling functionalities like real-time monitoring, predictive analytics, and automation
The Internet of Things (IoT) has revolutionized how we collect, process, and analyze data. Real-time data streaming is at the heart of many IoT applications, enabling functionalities like real-time monitoring, automation, and predictive analytics.
In this article, we delve into the process of streaming real-time data from an IMU sensor system using MQTT. Specifically, we’ll focus on interfacing the BMI160 IMU sensor with a Raspberry Pi, transmitting its data over MQTT, and setting the foundation for visualization. This comprehensive guide will cover step-by-step instructions for hardware setup, software configuration, and seamless data streaming to enable efficient real-time monitoring.
This entire process can be divided into two main parts. The first part focuses on collecting data from the BMI160 IMU sensor using a Raspberry Pi. This involves interfacing the sensor, configuring it to capture accelerometer and gyroscope data, and streaming this data in real-time using MQTT. The second part centers on visualizing the collected data. While this article emphasizes data collection and streaming, the visualization can be achieved using tools like Grafana, which connects to MQTT to provide a graphical representation of the sensor data for analysis and monitoring.
The BMI160 is a high-performance IMU sensor equipped with a 3-axis accelerometer and a 3-axis gyroscope. Known for its compact design, low power consumption, and versatile communication interfaces (I²C and SPI), it is widely used in embedded systems for motion sensing and orientation detection.
To set up the system, the following components are needed:
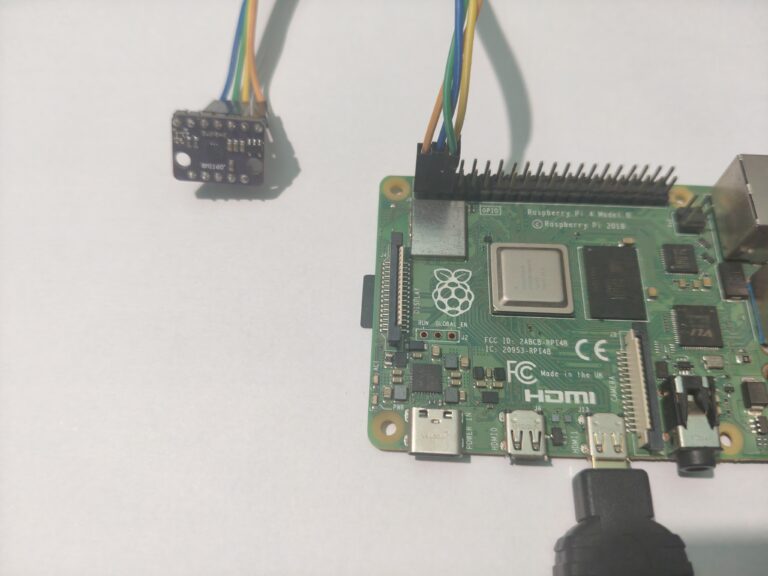
Pin Connections
The BMI160 communicates with the Raspberry Pi using the I²C protocol. Here are the necessary connections:
BMI160 Pin | Description | Raspberry Pi 4 Pin |
VCC | Power Supply | Pin 1 (3.3V) |
GND | GND | Pin 6 (GNCD) |
SDA | I²C Data Line | Pin 3 (SDA) |
SCL | I²C Clock Line | Pin 5 (SCL) |
Note: Ensure the presence of 4.7kΩ pull-up resistors on the SDA and SCL lines if they are not included on the BMI160 breakout board.
The Raspberry Pi serves as the I²C master, while the BMI160 operates as the slave device. Communication occurs via data exchange through specific registers on the BMI160, such as those for accelerometer or gyroscope data. The default I²C address for the BMI160 is 0x68, or 0x69 if the SDO pin is pulled high.
Configuring the Raspberry Pi for I²C Communication
To prepare the Raspberry Pi for communication with the BMI160:
Enable I²C
Use the following command to access the configuration tool:
sudo raspi-config
This will launch the raspi-config utility. Select “Interface Options”
Install Required Tools
Install the utilities needed to debug I²C communication:
sudo apt-get install -y i2c-tools
Detect the BMI160 Sensor
Run the following command to confirm the I²C connection:
i2cdetect -y 1
The BMI160’s address (0x68 or 0x69) should appear in the output grid.
Check the test.py script in the repository to see an example of how to initialize the BMI160, read data, and handle sensor outputs.
MQTT (Message Queuing Telemetry Transport) is a lightweight messaging protocol designed specifically for IoT systems. It uses a publish-subscribe architecture, allowing devices to send and receive messages efficiently. Its minimal overhead and ability to operate in low-bandwidth environments make it ideal for streaming real-time sensor data, such as the motion and orientation readings from the BMI160 IMU sensor.
To enable real-time data streaming, the Raspberry Pi needs an MQTT broker to manage message publishing and subscribing. Here’s how to set it up.
Mosquitto is a popular open-source MQTT broker that is easy to install and configure. Run the following command to install it:
sudo apt-get install -y mosquitto mosquitto-clients
To stream real-time data from the BMI160 IMU sensor, the script should first establish I²C communication between the Raspberry Pi and the sensor, ensuring that the accelerometer and gyroscope readings are enabled. Once initialized, the script should periodically fetch raw sensor data, typically every 100 milliseconds, and process it as needed (e.g., converting raw values into physical units like m/s² for acceleration or degrees per second for angular velocity).
The processed data can then be structured, for example, as JSON, and published to specific MQTT topics using a library such as paho-mqtt. Common topics could include imu/accelerometer for acceleration data and imu/gyroscope for angular velocity data. This setup allows for seamless integration of sensor data into an MQTT-based IoT ecosystem.
By combining the BMI160’s sensor data collection capabilities with MQTT’s lightweight messaging protocol, the Raspberry Pi acts as a gateway for real-time motion data. The data can be streamed to various subscribers, including visualization tools or other IoT devices, enabling seamless integration into larger systems.
This approach not only facilitates real-time monitoring but also provides a scalable solution for IoT applications involving motion sensing and data analysis.
To illustrate how the BMI160 IMU sensor can be integrated with MQTT for real-time data streaming, we’ve provided a Python implementation. This script captures motion data from the BMI160 sensor and processes it to calculate and publish gyroscope, accelerometer, speed, and orientation data via MQTT. The IMUSensorManager class encapsulates these functionalities, ensuring modularity and ease of extension.
Key highlights of the implementation:
This script serves as a practical foundation for projects requiring motion sensing and real-time data streaming. The complete code can be accessed here.
InfluxDB is a purpose-built in-memory time-series database designed to handle large volumes of time-stamped data such as metrics, events, and sensor readings. Its architecture is optimized for fast writing and efficient querying of time-based data, making it a perfect fit for IoT and monitoring projects.
For this project, InfluxDB serves as the central data store, ingesting and organizing real-time data streamed from sensors via MQTT. This allows us to analyze trends, monitor system performance, and visualize sensor metrics in tools like Grafana. Its seamless integration with tools like Telegraf and Grafana makes it a critical component for building a robust and scalable monitoring solution.
The data flow in this IoT monitoring system ensures seamless real-time processing and visualization of sensor data. Here’s how the data moves through the system:
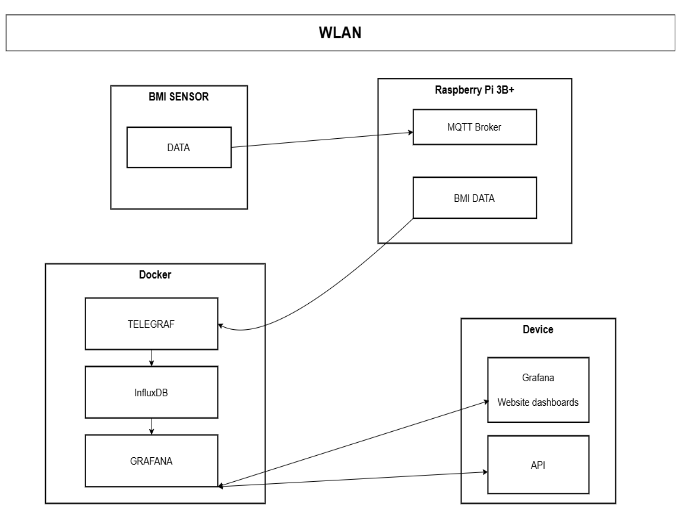
This streamlined data flow ensures that the raw sensor data collected by MQTT is efficiently processed, stored, and visualized, enabling actionable insights and effective monitoring of the system.
Grafana is a powerful open source tool for creating interactive and dynamic dashboards that visualize and monitor real-time data from multiple sources. By integrating Grafana with InfluxDB, a high-performance time-series database, one can easily collect, store, and display live sensor metrics, system performance data, or any other time-stamped information.

Our solution comes with an out-of-the-box Grafana dashboard that allows viewing incoming data in real time immediately after deployment. This dashboard is designed as a template for monitoring IMU sensor data. One can also adjust the refresh time settings to customize the look and feel of the graphs.
By using Grafana and the InfluxDB database, to which data from the sensor is sent via Raspberry Pi, we can present real-time data as well as access historical data. The data shown is from the BMI160 sensor.
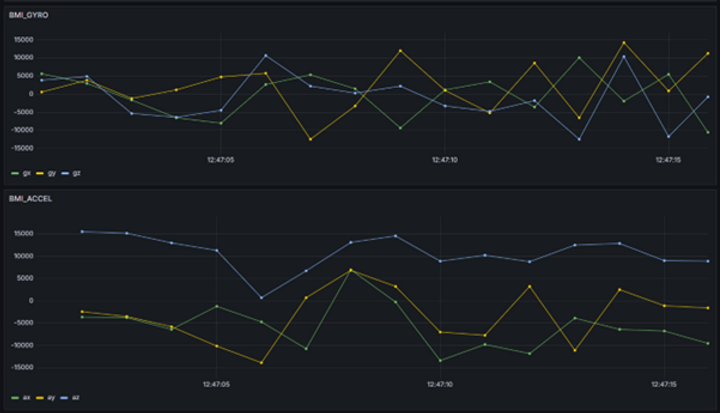
The line graphs show data from the accelerometer and gyroscope.
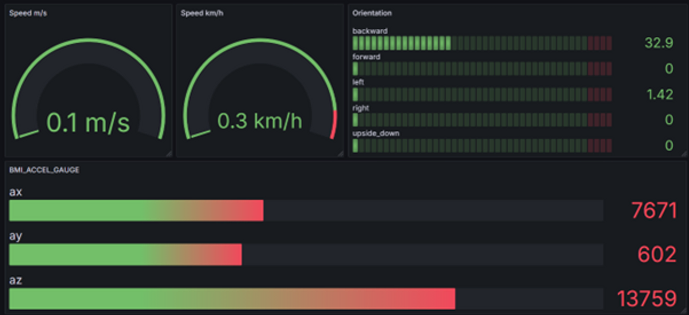
The pie charts show the processed speed measurements in m/s and km/h. First bar graph shows the orientation of the sensor in the XY plane, allowing us to determine if it is tilted forward, for example. Second bar graph displays data from the accelerometer.
This setup provides an intuitive and dynamic visualization of sensor data, enabling both real-time monitoring and historical data analysis.
This video below shows system behavior in real-life:
MalikRihan R (PacketPath)
Dominik S. (Apptimia)
This proof of concept was prepared in collaboration between engineers from Packet Path (www.packetp.com). andApptimia (www.apptimia.com). Packet Path dealt with embedded, lower-level part of the project, whereas Apptimia focused on MQTT, Grafana and cloud. See the respective web pages of both companies for details of their portfolio and services.
Packet Path is your gateway to innovative IoT solutions. At Packet Path, we are dedicated to revolutionising the IoT industry by creating innovative and user-friendly IoT products and services